Excel workbook for Shopify & DTC brands running paid ads
Know the ROAS you actually need to make money.
Calculate your break-even ROAS, max CPA and contribution profit after ads using your own margins and costs. Then decide whether to scale, hold or cut each campaign.
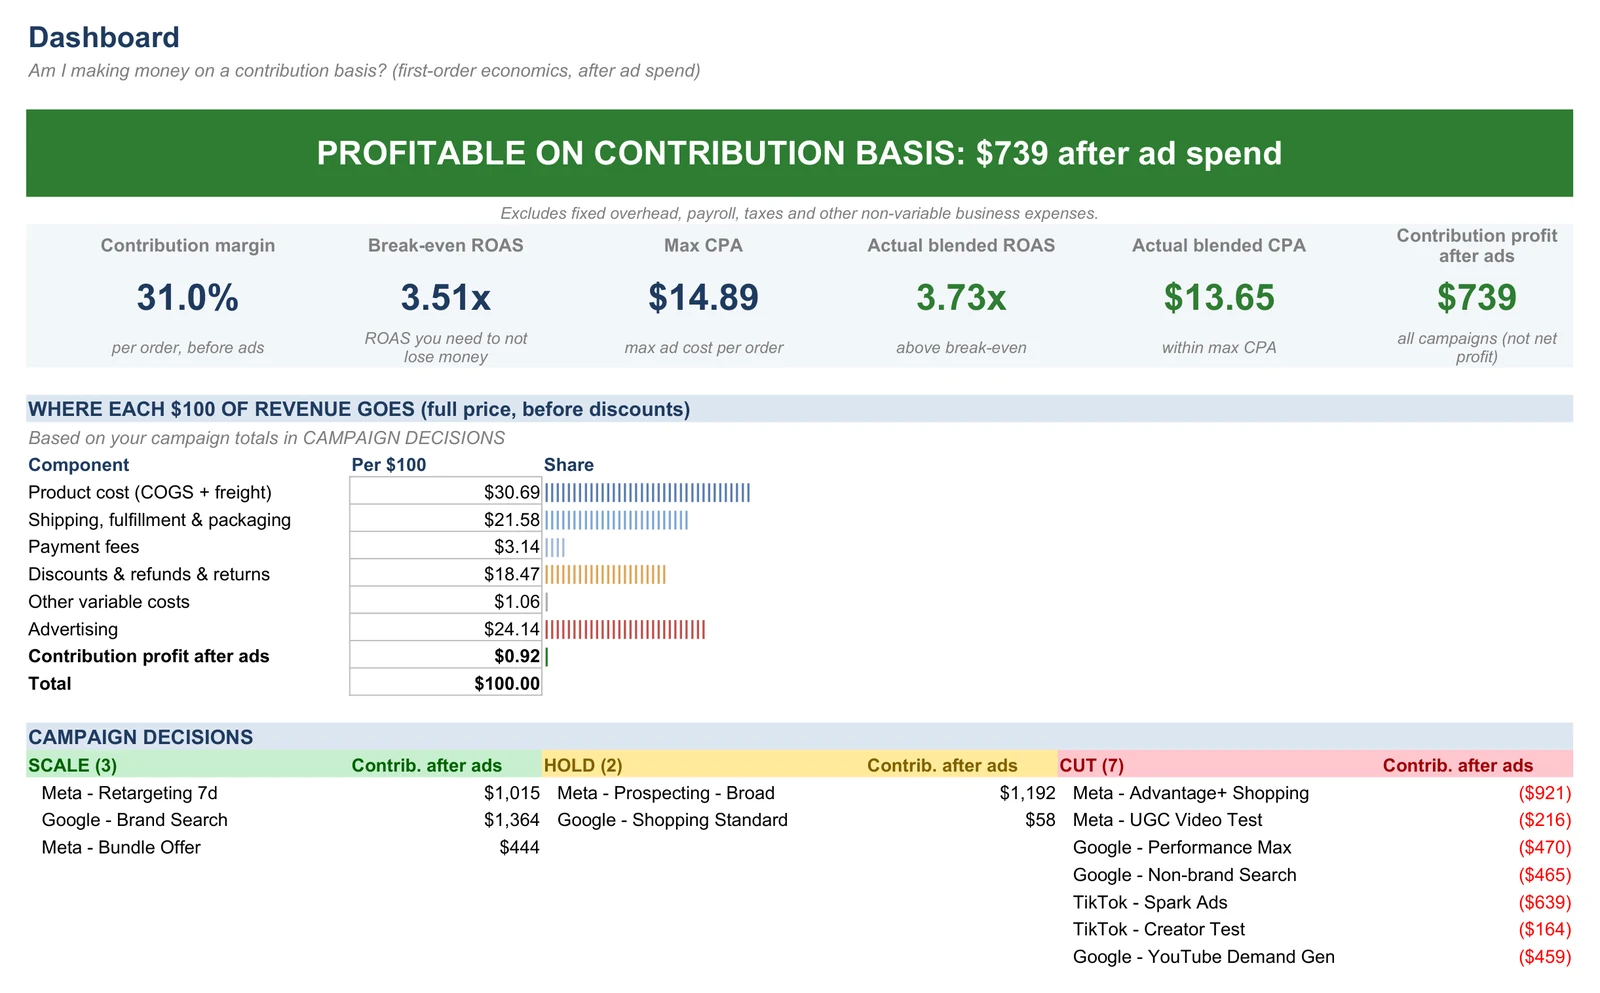
ROAS alone doesn't tell you if a campaign makes money
Ad platforms report revenue and ROAS. Neither one tells you what's left after product cost, shipping, fulfillment, payment fees, discounts and returns. Whether a ROAS is good enough depends entirely on your margins.
A 3x ROAS campaign can still lose money if your contribution margin means you need 4x or more just to break even.
From the sample workbook
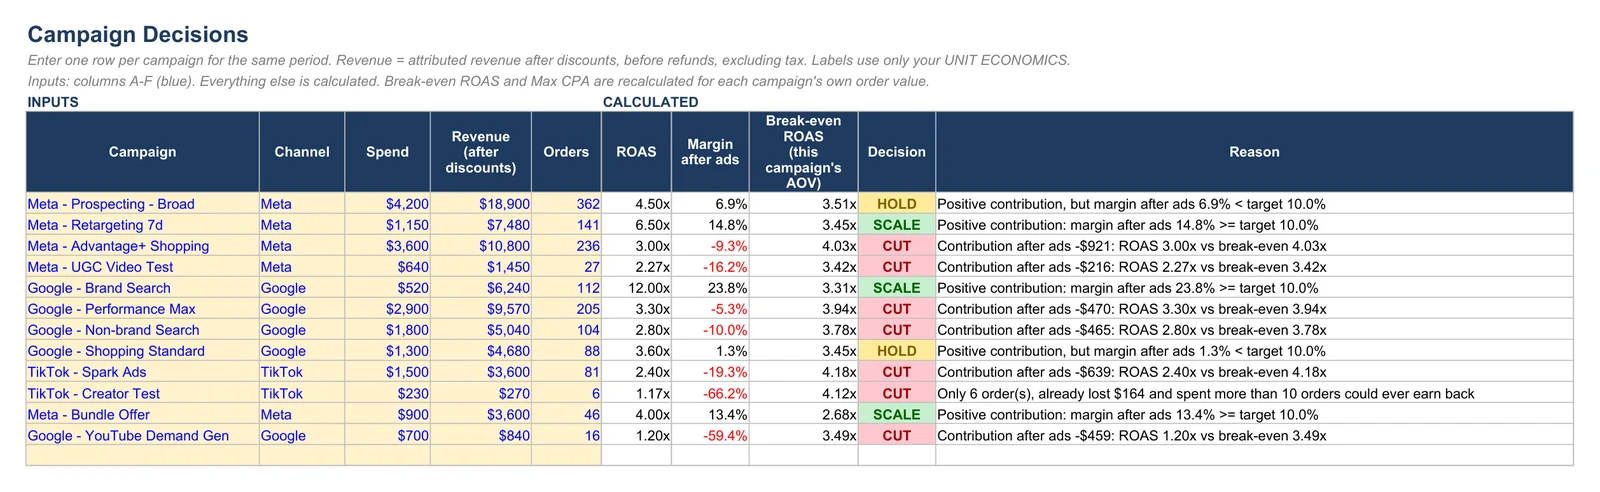
Meta – Advantage+ Shopping shows a 3.00x ROAS. At that campaign's order value, break-even ROAS is 4.03x, so it is −$921 on contribution after ads. The workbook labels it CUT.
What it calculates
Contribution margin
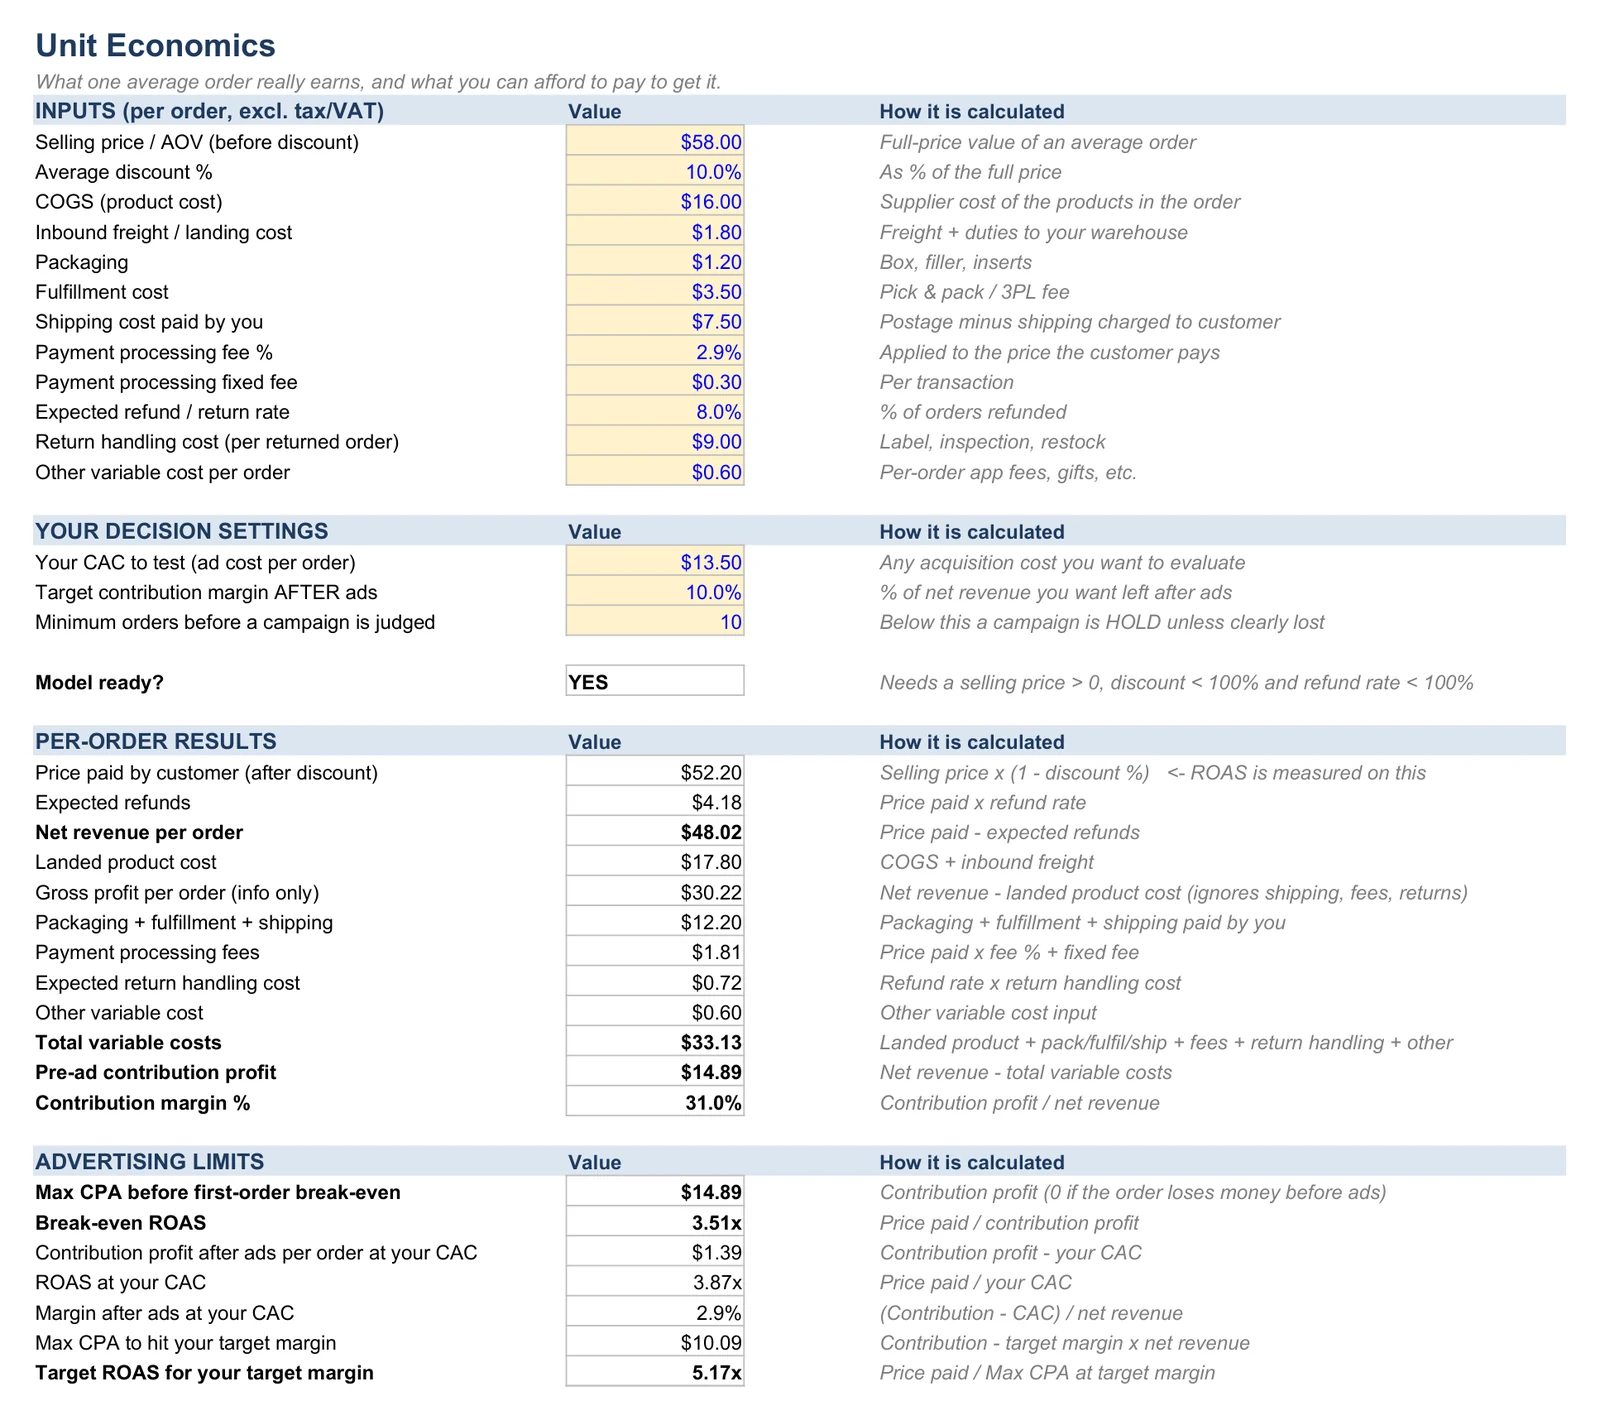
What each order earns after every variable cost: product, freight, packaging, fulfillment, shipping, payment fees and returns.
Break-even ROAS
The minimum ROAS that pays for the ads out of your contribution profit.
Maximum CPA
The most you can pay in ads for one order before the first order loses money.
Contribution profit after ads
Per campaign and in total: contribution profit minus ad spend.
SCALE / HOLD / CUT
A decision label and a one-line reason for up to 30 campaigns, based only on your own economics and target margin.
Price & discount scenarios
Compare 3 price or discount scenarios, see the largest discount you can afford, and the price needed for a target margin.
What you'll see
Real renders of the included sample workbook. All numbers are example data.
How it works
Enter your economics
Average order value, discount, product cost, shipping, fulfillment, payment fees and refund rate.
Add your campaigns
Spend, revenue and orders for each campaign over the same period, from any ad channel.
Read the signals
See break-even ROAS, max CPA, contribution profit after ads and a SCALE / HOLD / CUT label for each campaign.
Who it's for
Small Shopify and DTC brands that:
- run Meta, Google or TikTok ads
- want a lightweight economics tool
- don't need a full analytics SaaS
- want to understand their contribution economics themselves
What you get
- Clean XLSX workbook, ready for your numbers
- Sample XLSX workbook with example data
- Quick Start guide (PDF)
- One-time purchase, no subscription
- No Shopify integration required
$29 one-time
Get the Kit — $29Delivered as .xlsx files for Microsoft Excel.
What it is, and what it isn't
- It's a decision-support workbook. It doesn't replace accounting or financial software.
- It is not accounting, tax, legal or financial advice.
- Contribution profit is not net profit. Fixed overhead, payroll, taxes and other non-variable company costs are excluded.
- Results are estimates based on the costs and campaign numbers you enter. Decisions use first-order economics, so repeat purchases are not counted.
- XLSX is the supported delivery format for v1.0.
FAQ
Does it connect to Shopify?
No. You enter your own numbers. There's no integration, account or API to set up.
Is this accounting software?
No. It's a spreadsheet for advertising and unit-economics decisions, not a bookkeeping, accounting or financial tool.
Is $29 recurring?
No. It's a one-time purchase.
Does it calculate net profit?
No. It calculates contribution economics and contribution profit after advertising, based on the costs you supply. Fixed overhead, payroll, taxes and other non-variable costs are not included.
Can I use it for Meta, Google or TikTok?
Yes. Campaign rows are channel-independent, so any channel that reports spend, revenue and orders works.
Find out which campaigns actually earn their spend.
Get the Kit — $29One-time purchase · .xlsx download